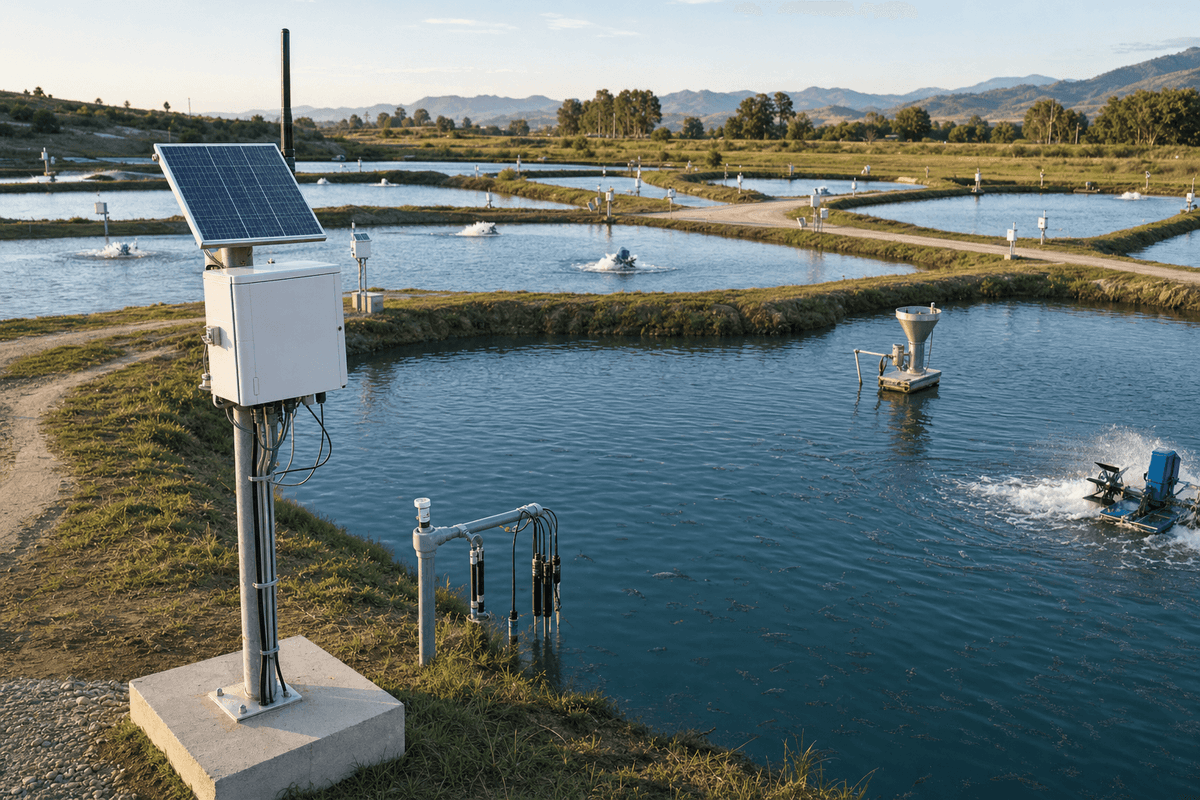
Aquaculture + Fish Farm Smart Agriculture IoT Monitoring System - 10 ha 4G Water Quality Control
Key Features
- Covers 10 hectares and 8 ponds with 24 IP68 water-quality sensing points.
- Monitors 6 key parameters: temperature, pH, dissolved oxygen, ammonia, turbidity, and salinity.
- Uploads data every 10 minutes via 4G LTE, configurable from 1 to 60 minutes.
- Includes automatic aerator control and feeder integration to reduce response time from hours to minutes.
- Solar medium power system with 80W-class panel and LFP battery supports remote outdoor operation.
The SOLARTODO Aquaculture + Fish Farm Smart Agriculture IoT Monitoring System is configured for 10 hectares and 8 ponds with 24 IP68 water-quality sensing points, 4G communications, solar medium power, professional cloud analytics, automatic aerator control, and feeder integration. It monitors temperature, pH, dissolved oxygen, ammonia, turbidity, and salinity at 10-minute intervals to reduce mortality risk, improve feed conversion, and support data-driven aquaculture operations.
Description
The Aquaculture + Fish Farm variant of the Smart Agriculture IoT Monitoring System is a 10-hectare, 8-pond monitoring and control platform designed for commercial aquaculture operations that require continuous visibility into 6 critical water parameters: temperature, pH, dissolved oxygen (DO), ammonia, turbidity, and salinity. This configuration includes 24 IP68 submersible sensing points, 4G connectivity, solar medium-power field nodes, a professional cloud platform, automatic aerator control, and feeder integration, with standard data upload every 10 minutes and configurable intervals from 1 to 60 minutes.
For B2B fish farms, shrimp ponds, hatcheries, and integrated aquaculture estates, the system addresses 3 core operational risks: oxygen depletion within hours, ammonia accumulation over 1 to 3 days, and feed inefficiency that can exceed 5% to 15% of annual operating cost. Compared with conventional manual testing using handheld meters 1 to 3 times per day, continuous sensing can detect rapid overnight DO decline, reduce delayed response events, and support more stable production. According to the IEA, digitalization and automation improve operational efficiency across infrastructure sectors, while IRENA and NREL consistently note that distributed solar-powered edge devices lower dependence on grid extension for remote sites. In pond aquaculture, that translates into more resilient monitoring at distances of 1 to 10 km from the farm office.
Why Continuous Aquaculture Monitoring Matters
In warm-water aquaculture, a 1 to 2 mg/L drop in dissolved oxygen can move a pond from acceptable to stress conditions in less than 2 hours, especially when biomass density rises above 15 to 30 kg/m3 depending on species and culture method. pH swings of 0.5 to 1.0 units can change ammonia toxicity, while turbidity spikes can indicate feed waste, algal bloom instability, or sediment disturbance. This system is built to monitor those changes automatically across 8 ponds, giving operators a single dashboard instead of relying on 8 separate paper logs or manual rounds.
The system aligns with widely recognized field requirements for environmental monitoring equipment, including IP67/IP68 enclosure practice for outdoor and submersible devices, WMO principles for environmental data quality, and integration-ready architecture consistent with digital agriculture frameworks such as ISO 11783 for connected farm equipment ecosystems. Although aquaculture water probes are application-specific, the broader communication, electrical protection, and cloud architecture follow common industrial design practice used in IEC-compliant low-voltage and telemetry systems. For project developers and EPC contractors, this reduces technical ambiguity during procurement, installation, and commissioning over a 2-year hardware and 1-year cloud support horizon.
System Configuration for 10 ha and 8 Ponds
This variant is optimized for a farm footprint of 10 hectares with 8 ponds, using 24 sensors distributed at representative hydraulic and biological points, equivalent to an average of 3 sensing positions per pond. In practical deployment, each pond can be instrumented for near-inlet, center-zone, and high-risk biomass areas, or configured by species and aeration pattern. The selected parameter set covers 6 water-quality indicators, which is sufficient for most freshwater and brackish-water fish or shrimp operations where oxygen stress, pH drift, and nitrogen loading are the leading causes of emergency intervention.
A typical bill of functionality includes 24 water-quality sensing channels, 1 4G gateway/controller, 1 solar medium power kit, cloud licensing for the professional tier, and control outputs for aerators and feeders. The professional cloud tier supports historical trend analysis, threshold alarms, user permissions, and API access, enabling farm managers, integrators, and third-party software teams to work from the same dataset. To explore adjacent models for greenhouses, open fields, or mixed farm estates, buyers can View all Smart Agriculture IoT Monitoring System products and compare coverage, communication, and sensor density.
Parameters Monitored and Operational Value
Temperature affects metabolism, feeding rate, dissolved oxygen saturation, and disease risk; in many fish species, a sustained shift of 2 to 4°C can materially alter feed conversion ratio and growth speed. pH is monitored because values outside the normal operating band, often around 6.5 to 8.5 depending on species, can stress stock and change the ionized versus unionized ammonia balance. Dissolved oxygen is the most time-critical parameter, with many farms setting warning thresholds near 4 to 5 mg/L and emergency action thresholds closer to 3 mg/L.
Ammonia monitoring is essential where feed input is high and water exchange is limited, because elevated total ammonia nitrogen can increase mortality risk and suppress growth over 24 to 72 hours. Turbidity is useful for identifying solids loading, phytoplankton instability, and excess feeding, while salinity is required in brackish systems and in farms where seasonal dilution can shift osmoregulatory stress. Together, these 6 parameters form a practical decision layer for pond management, especially when combined with timestamped alerts and trend curves over 7-day, 30-day, and seasonal periods.
System Architecture
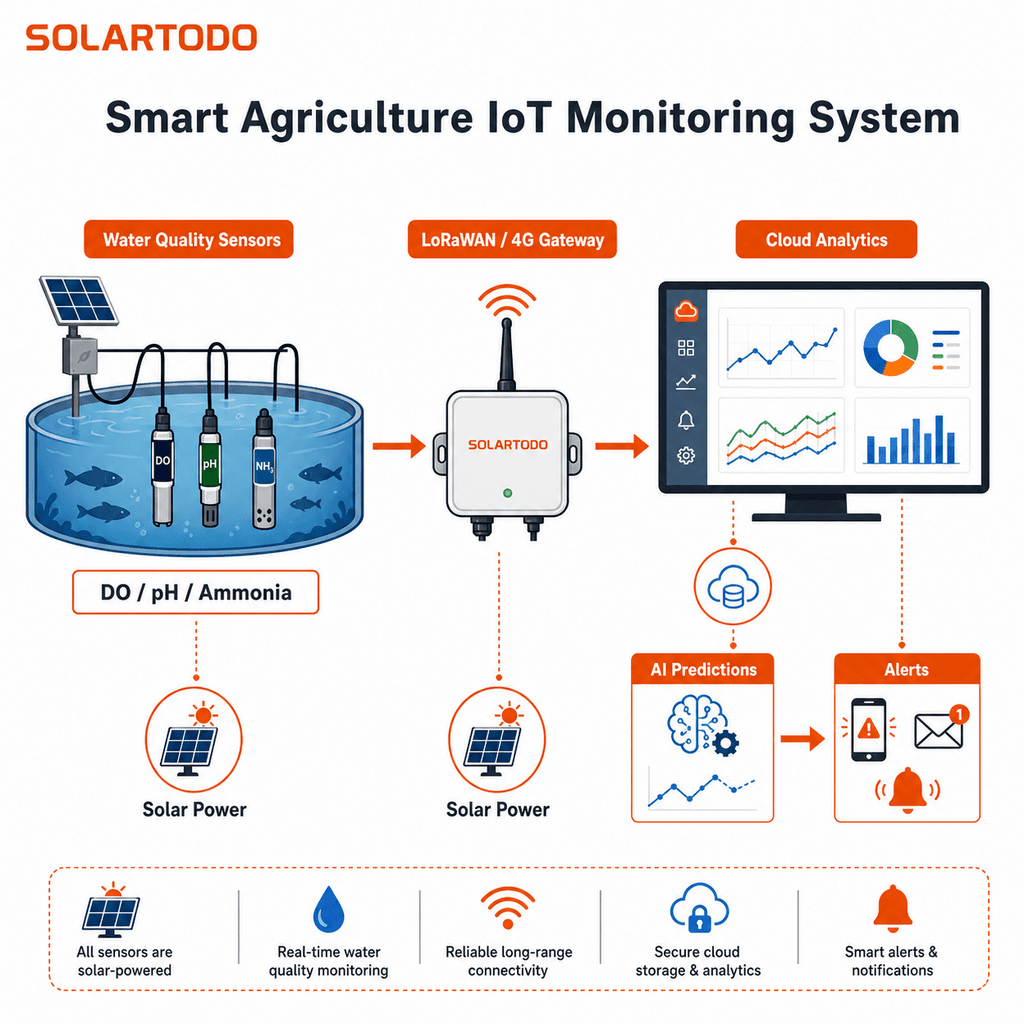
The architecture combines IP68 submersible probes, a field controller with 4G LTE backhaul, local control logic for aerators and feeders, and a solar-powered energy subsystem sized for maintenance-free outdoor operation. Data is collected every 10 minutes by default and stored locally if mobile coverage is interrupted, then retransmitted automatically when the network recovers. This is important on rural sites where signal quality can vary by 5 to 20 dB during weather events or tower congestion periods.
At the control layer, the platform can trigger auto-aerator activation when DO falls below a defined threshold, such as 4.0 mg/L, and can coordinate feeder schedules based on time windows, operator rules, or future API integration with biomass models. Compared with conventional standalone timers, sensor-driven control can reduce unnecessary aerator runtime and avoid feeding during poor water-quality windows. Operators can Configure your system online to adjust pond count, communication mode, cloud tier, and control logic before requesting engineering review.
Communication, Power, and Reliability
This configuration uses 4G communication because aquaculture sites often require higher-bandwidth and lower-latency data transmission than purely passive environmental logging, especially when operators want image uploads, rapid alarm delivery, or remote troubleshooting. While LoRaWAN can cover up to 10 km radius under suitable conditions, 4G is preferred for many fish farms because it simplifies deployment to 1 gateway, avoids local network complexity, and supports direct cloud access. Data retransmission on network recovery helps preserve continuity during outages that may last 10 minutes to several hours.
Power is supplied by a solar medium system, typically centered on an 80 W-class panel with an LFP battery sized for outdoor telemetry and control loads. LFP chemistry is selected for cycle life that commonly exceeds 2,000 to 4,000 cycles, lower maintenance requirements, and better thermal stability than older lead-acid alternatives. In remote pond areas where trenching AC power can cost more than $5 to $20 per meter, solar field power can reduce civil work, accelerate installation, and maintain operation during grid interruptions.
Cloud Monitoring and Analytics
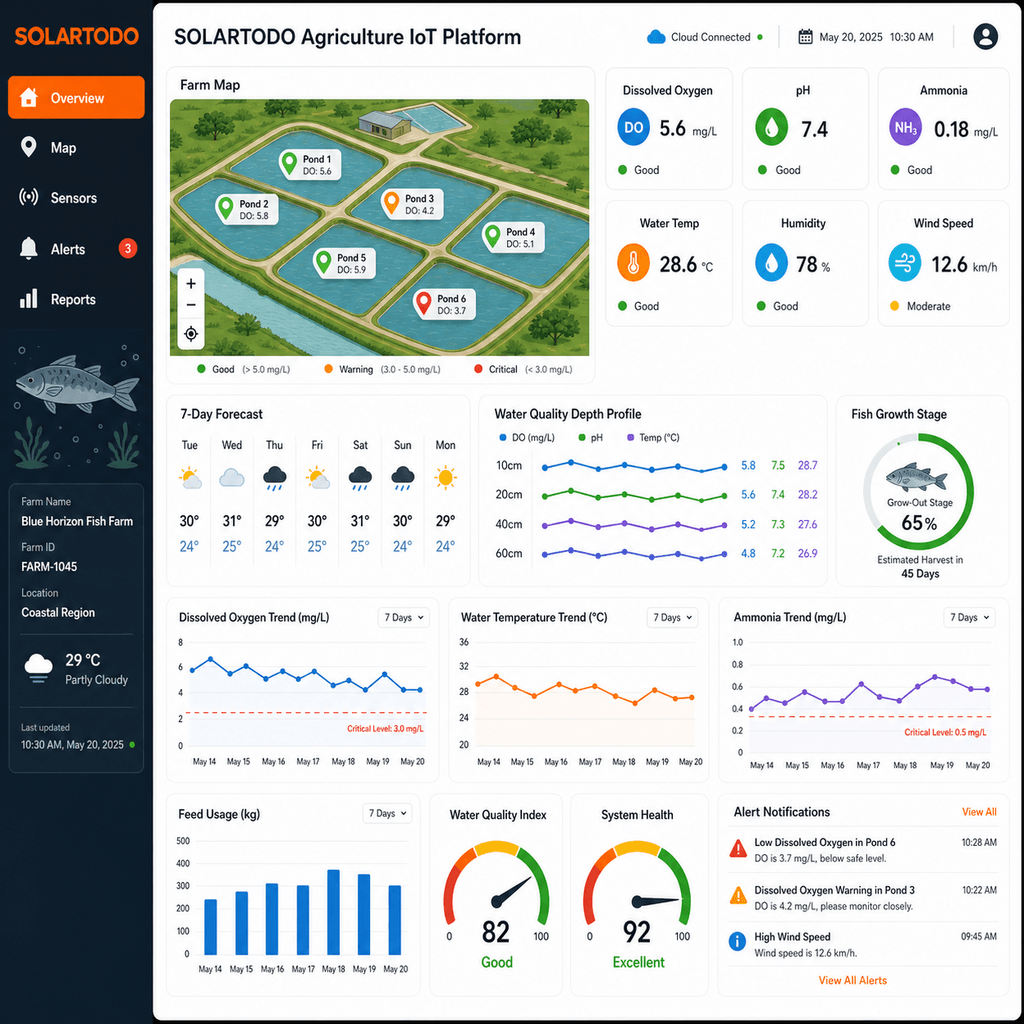
The professional cloud platform provides real-time dashboards, historical trend analysis, threshold alarms, device status, and user-level access for at least 3 common stakeholder groups: farm managers, maintenance technicians, and owners or investors. Data can be viewed by pond, parameter, time interval, and alarm severity, allowing a manager to compare all 8 ponds in one interface. Alert channels include SMS, email, and app push, which is critical because DO emergencies often occur at night between 00:00 and 06:00 when staffing is minimal.
The platform also supports AI-oriented analytics such as anomaly detection, threshold-based predictions, and rule engines that can be extended through REST API integration. While aquaculture-specific AI performance depends on data history and husbandry consistency, even basic trend analytics can identify recurring low-oxygen periods, overfeeding indicators, or post-rain salinity dilution patterns across 30 to 90 days. Buyers planning ERP, SCADA, or farm MIS integration can Request a custom quotation for API mapping, dashboard branding, and multi-site deployment design.
Application Scenario: 8-Pond Warm-Water Fish Farm
A warm-water fish farm in Southeast Asia operating 8 ponds across 10 hectares deployed a comparable monitoring strategy after recurring overnight DO events caused losses during the hottest 3 months of the year. Before deployment, staff used handheld meters 2 times per day, which missed early-morning oxygen crashes and delayed aerator start by 30 to 90 minutes. After adding continuous sensing, cloud alerts, and automatic aerator activation, the farm reduced emergency mortality incidents and improved feeding discipline during unstable water conditions.
In that scenario, the operator used 24 sensing points to separate high-density ponds from lower-density ponds, with DO alarms set at 4.2 mg/L and feeder lockout during severe turbidity or low-oxygen events. Compared with manual-only monitoring, the farm reported lower labor intensity for routine checks, fewer after-hours callouts, and better visibility into ammonia accumulation after heavy feeding cycles. Results vary by species, stocking density, and management quality, but continuous monitoring commonly delivers faster response than manual sampling by a factor of 10 to 100 times in terms of data frequency.
Comparison with Conventional Manual Monitoring
Conventional pond management often relies on portable meters, paper records, and timer-based aerators, with staff testing 1 to 3 times daily and making control decisions from incomplete snapshots. That approach can be acceptable for low-density operations under stable weather, but it is weak for intensive farms where water quality can change materially within 30 to 120 minutes. By contrast, this system records data every 10 minutes, stores it centrally, and can trigger immediate control outputs when thresholds are exceeded.
From a cost perspective, manual monitoring may appear cheaper at the start, but it can create hidden losses through missed oxygen events, over-aeration, excess feed, and inconsistent reporting. If a farm avoids even 1 moderate mortality event or reduces aerator runtime by 5% to 15%, the value can exceed the annual cloud and maintenance cost. In addition, digital records improve auditability for buyers, insurers, lenders, and certification-oriented supply chains that increasingly expect traceable production data. For broader technical background, buyers can Learn about topic and review system planning guidance across smart agriculture deployments.
Compliance, Standards, and Engineering Basis
The system references recognized engineering frameworks rather than informal consumer-grade electronics. Sensor housings and field electronics are designed around IP67/IP68 outdoor protection expectations; environmental data collection follows practical quality principles consistent with WMO measurement discipline; and farm-system interoperability can align with ISO 11783-style digital agriculture integration. For power subsystem design, solar charging and battery sizing are informed by field practice commonly used in remote telemetry and by renewable-energy guidance published by NREL and IRENA.
Authoritative market and technology context also supports the business case. IEA and BloombergNEF have documented the increasing role of digital control and distributed energy in infrastructure efficiency, while Wood Mackenzie has highlighted the value of operational data for asset optimization. In aquaculture specifically, environmental stability and response speed are measurable drivers of output quality and survivability. These references do not replace farm-specific biological management, but they support the engineering logic behind a 24-point, 4G-connected, solar-powered monitoring network for remote ponds.
Technical Specifications
The following configuration reflects the requested variant and standard template values for this product line:
| Parameter | Value | Unit |
|---|---|---|
| Coverage Area | 10 | hectares |
| Pond Count | 8 | ponds |
| Monitoring Types | water quality | - |
| Water Parameters | temp, pH, DO, ammonia, turbidity, salinity | 6 params |
| Total Sensors | 24 | sensors |
| Communication | 4G LTE | - |
| Power Supply | solar medium | 80W class |
| Data Interval | 10 min configurable 1-60 | minutes |
| Cloud Platform | professional | tier |
| Alert Channels | SMS + Email + App Push | 3 channels |
| API Access | REST API included | - |
| Aerator Control | automatic threshold-based | yes |
| Feeder Integration | scheduled / rule-based | yes |
| Warranty | 2 years hardware, 1 year cloud | - |
EPC Investment Analysis and Pricing Structure
For aquaculture buyers, EPC means a complete package covering engineering, procurement, construction, commissioning, training, and warranty support rather than equipment-only supply. In practical terms, this includes site review for 8 ponds, cable and mounting design, controller configuration, sensor installation, threshold setup, cloud onboarding, alarm testing, and operator training over 1 commissioning cycle. This structure is designed for farms that want a single accountable supplier path instead of splitting responsibility across 3 to 5 vendors.
Three-Tier Pricing
| Supply Scope | Price Range (USD) | Typical Inclusions |
|---|---|---|
| FOB Supply | $1,240 - $1,768 | Equipment only, ex-works China |
| CIF Delivered | $1,293 - $1,844 | Equipment + ocean freight + insurance |
| EPC Turnkey | $2,000 - $2,600 | Installed, commissioned, 1-year warranty |
Volume Discount Schedule
| Order Volume | Discount |
|---|---|
| 50+ systems | 5% |
| 100+ systems | 10% |
| 250+ systems | 15% |
ROI and Cost Comparison
For a typical 10-hectare fish farm, annual economic benefit usually comes from 3 channels: reduced mortality risk, lower unnecessary aerator runtime, and improved feed management. If the system avoids losses or waste equal to only $900 to $1,500 per year, an EPC investment of $2,000 to $2,600 can produce a simple payback of roughly 1.3 to 2.9 years. Compared with manual-only monitoring and timer-based aeration, the digital system can reduce emergency response delay from hours to minutes and improve labor productivity by reducing routine manual checks across 8 ponds.
A conventional alternative might include 2 handheld meters, manual labor rounds, and standalone timers at a combined first cost near $600 to $1,200, but it lacks continuous records, remote alarms, cloud analytics, and automated control. When farms operate at higher biomass or sell into quality-sensitive channels, the value of traceable data and faster intervention often outweighs the extra capital cost. For projects above $1,000K, financing support can be discussed alongside phased deployment and multi-site standardization.
Payment Terms
Standard payment terms are 30% T/T deposit + 70% against B/L, or 100% L/C at sight for qualified transactions. For portfolio projects above $1,000K, financing discussion is available subject to project scope, jurisdiction, and buyer credit review. Commercial inquiries can be sent directly to [email protected].
Deployment, Integration, and Service
Installation typically requires 1 gateway/controller, 24 probe placements, solar mounting, cloud activation, and control logic setup for aerators and feeders. Depending on pond spacing and civil conditions, field deployment can be completed in 1 to 3 days for a standard 8-pond site, followed by commissioning and training. The system is suitable for new farms, retrofit projects, or phased modernization where digital monitoring is introduced before broader automation.
The included REST API supports integration with third-party dashboards, supervisory software, and enterprise reporting tools. This is useful for operators managing 2 to 20 farms who want a unified view of alarms, water quality, and equipment status. Additional technical planning resources are available at Learn about topic, and project-specific design assistance is available through the SOLARTODO engineering team.
Procurement Notes for B2B Buyers
For EPC contractors, distributors, and aquaculture developers, the key procurement variables are sensor count, pond geometry, communication quality, power autonomy, and control outputs. This standard variant is balanced for 10 hectares, but sites with longer cable runs, deeper ponds, or stricter redundancy requirements may need additional hardware. During RFQ review, buyers should confirm 3 to 5 points: target species, salinity range, desired alarm thresholds, feeder interface type, and expected reporting format.
SOLARTODO supplies smart agriculture, solar, storage, telecom-power, lighting, and infrastructure solutions for commercial projects, making cross-discipline integration easier where farms also need remote power, security, or perimeter lighting. For buyers comparing options, the fastest next steps are to Configure your system online, View all Smart Agriculture IoT Monitoring System products, or Request a custom quotation for a site-specific BOM and EPC proposal.
Technical Specifications
| Coverage Area | 10hectares |
| Pond Count | 8ponds |
| Monitoring Types | water quality- |
| Water Parameters | temp, pH, DO, ammonia, turbidity, salinity6 params |
| Total Sensors | 24sensors |
| Communication | 4G LTE- |
| Power Supply | solar medium80W class |
| Data Interval | 10min configurable |
| Cloud Platform | professionaltier |
| Alert Channels | SMS + Email + App Push3 channels |
| API Access | REST API included- |
| Aerator Control | trueenabled |
| Feeder Integration | trueenabled |
| Warranty | 2 years hardware, 1 year cloud- |
Price Breakdown
| Item | Quantity | Unit Price | Subtotal |
|---|---|---|---|
| Water Quality Sensor | 2 pcs | $800 | $1,600 |
| 4G Gateway | 1 pcs | $110 | $110 |
| Solar Power Kit (medium 80W) | 1 pcs | $225 | $225 |
| Cloud Platform Professional | 1 pcs | $48 | $48 |
| Engineering & QC | 1 pcs | $180 | $180 |
| Installation & Commissioning | 1 pcs | $260 | $260 |
| 1-Year Warranty & Support | 1 pcs | $120 | $120 |
| Total Price Range | $2,000 - $2,600 | ||
Frequently Asked Questions
What parameters does this aquaculture monitoring system measure?
How does the automatic aerator control work?
Is 4G communication reliable for remote fish farms?
What is included in the EPC turnkey price and warranty?
What payback period can a fish farm expect?
Certifications & Standards


Data Sources & References
- •NREL remote solar power and telemetry design guidance
- •IRENA renewable energy for distributed rural infrastructure
- •IEA digitalization and energy system efficiency reports
- •WMO environmental observation principles
- •ISO 11783 agricultural electronics interoperability framework
- •BloombergNEF digital infrastructure market analysis
- •Wood Mackenzie asset optimization and monitoring research
Interested in this solution?
Contact us for a customized quote based on your specific requirements.
Contact Us