Rooftop vs Ground-Mount Solar Cost Analysis 2026: ROI…

Cinn Song
Founder & Chief Solutions Architect
Watch the video
TL;DR
In North America, rooftop solar is usually best for warehouses, schools, and hospitals with strong roofs and limited land, while ground-mount solar often delivers lower LCOE above 500 kW. In 2026, rooftop projects typically cost $1.65-2.40/Wdc, ground-mount costs $1.45-2.15/Wdc, and payback commonly ranges from 4.0 to 8.5 years depending on tariffs and site conditions.
Rooftop solar in North America typically costs $1.65-2.40/Wdc in 2026, while ground-mount averages $1.45-2.15/Wdc; payback is 4.0-8.5 years depending on tariffs, roof condition, land cost, and tax-credit eligibility.
Summary
Rooftop solar in North America typically costs $1.65-2.40/Wdc in 2026, while ground-mount averages $1.45-2.15/Wdc; payback is 4.0-8.5 years depending on tariffs, roof condition, land cost, and tax-credit eligibility.
Key Takeaways
Procurement teams comparing rooftop and ground-mount solar in 2026 should model at least 3 variables: installed cost, annual yield, and avoided tariff.
- Compare rooftop at $1.65-2.40/Wdc against ground-mount at $1.45-2.15/Wdc before selecting a 100 kW-5 MW project layout.
- Prioritize rooftop solar when land value exceeds $50,000/acre or permitting timelines must stay below 6-9 months.
- Select ground-mount solar when a site can support 5-15% higher yield through optimal tilt, azimuth, row spacing, or tracking.
- Model U.S. commercial savings against the 2025 average tariff of $0.1341/kWh reported by EIA.
- Use 22-24.5% TOPCon or HJT modules to reduce roof area requirements by 8-15% versus older PERC layouts.
- Require IEC 61215, IEC 61730, UL 61730, and IEEE 1547 compliance for bankable North American interconnection.
- Include O&M at $15-35/kW-year for rooftop projects and $10-25/kW-year for ground-mount projects in ROI models.
- Request EPC pricing with FOB, CIF, and turnkey tiers because freight, labor, racking, permitting, and grid scope can move capex by 20-45%.
North America Market Context for 2026 Solar ROI
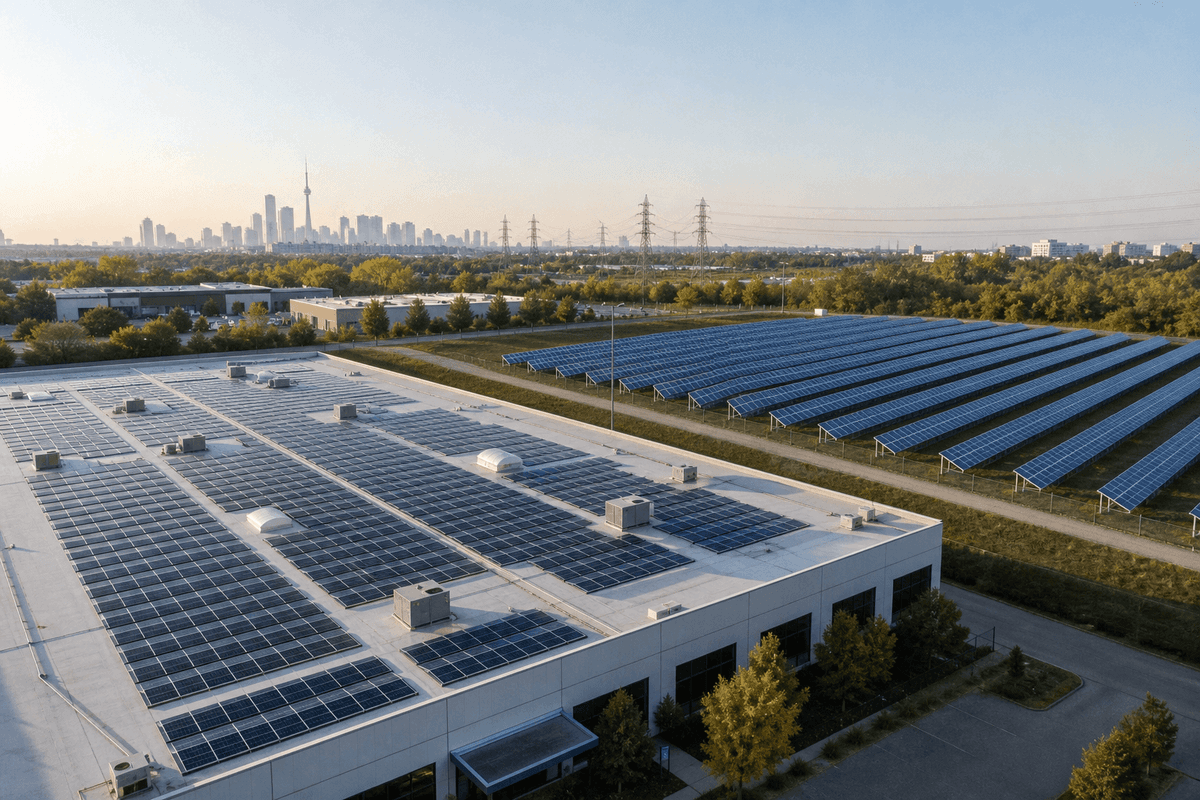
Commercial rooftop solar in North America usually wins when real estate is constrained, while ground-mount solar wins when land is available and annual yield improves by 5-15%.
The cost question in 2026 is not whether solar works; it is which mounting architecture produces the lowest delivered cost per usable kilowatt-hour. A rooftop system uses existing building area, avoids land acquisition, and normally shortens civil work. A ground-mount system adds foundations, trenching, fencing, and land control, but it can improve orientation, airflow, maintenance access, and future expansion.
According to Wood Mackenzie and SEIA (2026), the United States installed 43.2 GWdc of solar in 2025, a 14% decrease from 2024, while solar still represented 54% of new U.S. generating capacity. According to IEA (2025), renewable additions from 2025 to 2030 are projected at about 4,600 GW, with solar PV accounting for almost 80% of the increase. The International Energy Agency states, "Solar PV accounts for almost 80% of the global increase," which explains why module, inverter, and BOS supply chains remain deep even during policy volatility.
For North American B2B buyers, the rooftop-versus-ground decision is mostly a site economics problem. The United States offers large demand and higher soft costs, Canada has lower electricity rates in provinces such as Quebec but stronger commercial demand charges in some markets, and Mexico can show faster payback where business tariffs approach $0.20-0.24/kWh. SOLARTODO treats these as engineered quotation variables, not catalog checkout items, because roof structure, soil class, interconnection voltage, and Incoterms change the final EPC number.
| Region or market | 2025-2026 data point | Implication for rooftop vs ground-mount ROI |
|---|---|---|
| United States | 43.2 GWdc installed in 2025; commercial tariff averaged $0.1341/kWh | Strong C&I savings, but labor and permitting can raise rooftop soft costs |
| Canada | Alberta regulated default rate at 12.02 CAD cents/kWh for 2025-2026; Quebec business rates rose 3.8% in 2026 | ROI depends heavily on province and demand-charge structure |
| Mexico | Business electricity price around $0.240/kWh in December 2025 market data | High tariffs can compress payback to 3.5-6.0 years |
| Europe | IRENA reports high O&M compared with several regions, around $7.3/kW-year for utility PV in 2024 | Useful benchmark for mature permitting and grid standards |
| Asia-Pacific | China installed 277 GW of solar PV in 2024 according to IRENA | Module scale lowers global equipment prices for buyers worldwide |
| Middle East/Africa | High irradiation can support 1,700-2,100 kWh/kWp-year in strong sites | Ground-mount often wins where land and civil costs are low |
| Latin America | Brazil and Mexico combine high resource with commercial tariff exposure | Hybrid rooftop plus ground-mount portfolios can improve blended ROI |
Cost Structure: Rooftop vs Ground-Mount Systems
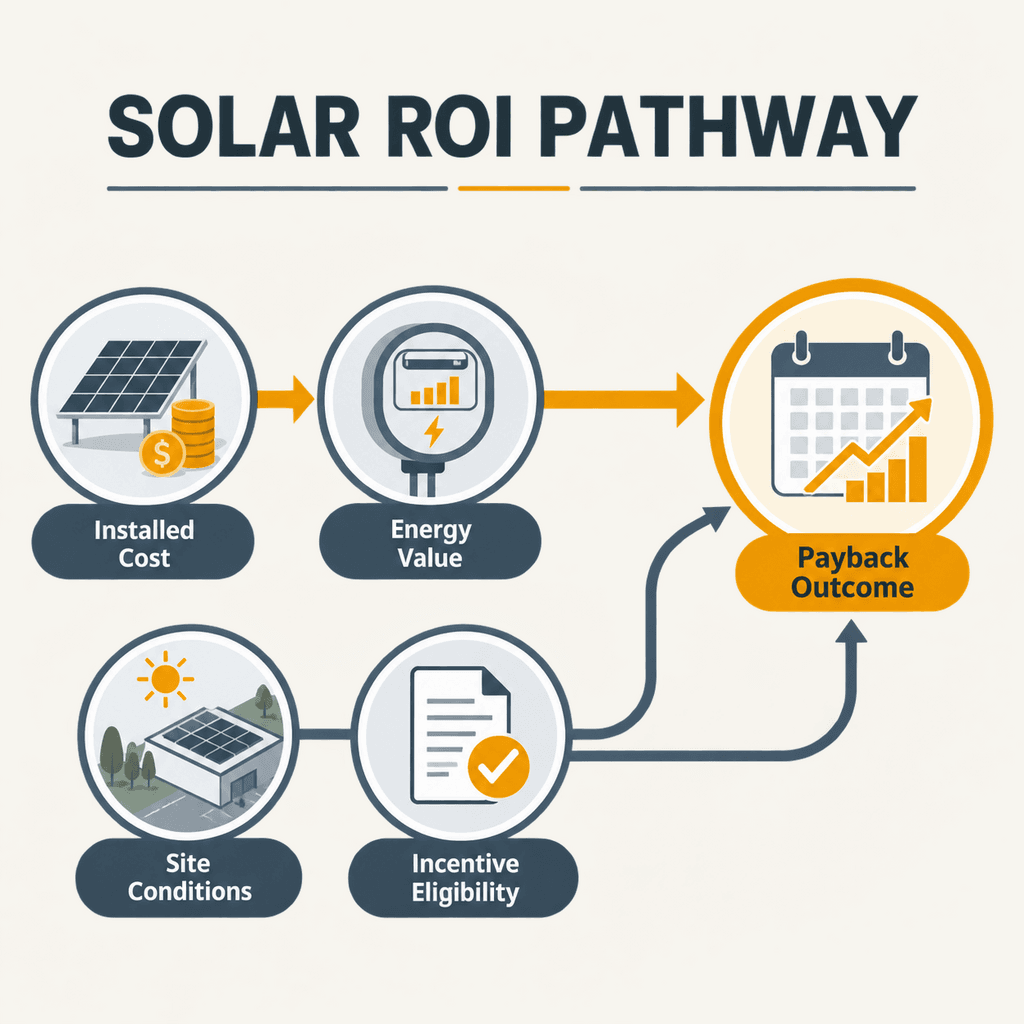
A 2026 North American commercial solar budget should separate modules, inverters, racking, labor, interconnection, civil works, and contingency across at least 7 line items.
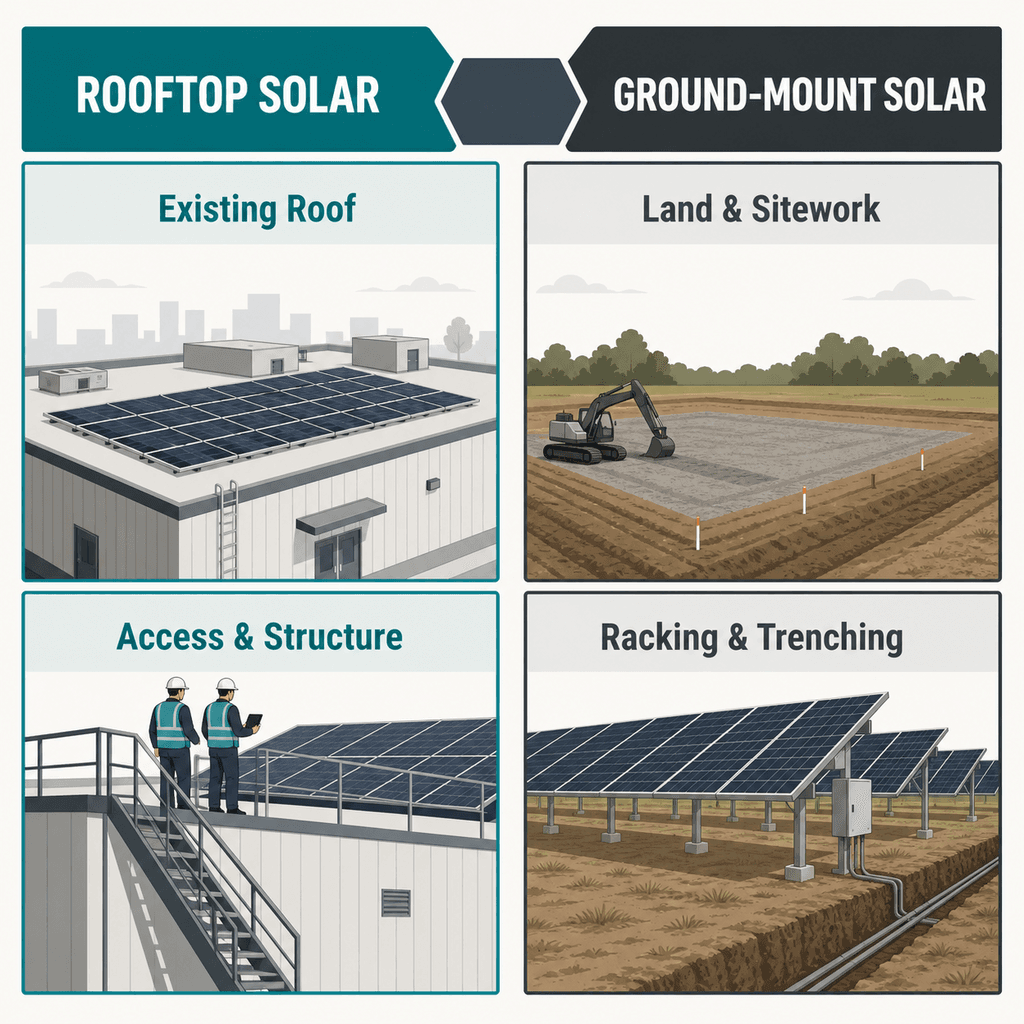
Rooftop systems typically spend less on land and foundations but more on structural review, roof attachments, waterproofing coordination, crane logistics, fire pathways, and constrained installation labor. Ground-mount systems spend more on piles, racking steel, trenching, fencing, grading, stormwater management, and land leasing, but installation crews can work faster and maintain better access.
According to the U.S. Department of Energy (2025), 2024Q1 benchmark values included $3.15/Wdc modeled market price for residential rooftop PV and $1.51/Wdc for a 3 MW agrivoltaic PV benchmark, with LCOE values of $142/MWh and $75/MWh respectively before incentives. According to NREL's Q1 2023 benchmark report, utility-scale one-axis tracking PV had a modeled market price of $1.17/Wdc, showing why large ground projects usually undercut small distributed systems on dollars per watt.
The 2026 procurement estimate below uses DOE/NREL benchmarks, Wood Mackenzie year-over-year pricing direction, and SOLARTODO export quotation experience as a screening range. It is not a binding quote; a North American stamped design can change capex by more than 10% after roof loading, geotechnical, utility, and labor review.
| System type | Typical 2026 installed range | Annual yield in North America | O&M planning range | Best-fit buyer profile |
|---|---|---|---|---|
| C&I rooftop, 100-500 kW | $1.65-2.40/Wdc | 1,200-1,650 kWh/kWp-year | $15-35/kW-year | Warehouses, schools, hospitals, retail roofs |
| C&I ground-mount, 500 kW-5 MW | $1.45-2.15/Wdc | 1,350-1,800 kWh/kWp-year | $10-25/kW-year | Factories, campuses, farms, water utilities |
| Carport solar, 250 kW-3 MW | $2.30-3.50/Wdc | 1,250-1,700 kWh/kWp-year | $20-40/kW-year | Parking-heavy institutions needing shade value |
| Utility ground-mount, 20-200 MW | $0.95-1.35/Wdc | 1,500-2,100 kWh/kWp-year | $10-22/kW-year | IPPs, utilities, corporate PPAs |
Rooftop solar can also avoid land entitlement costs, which is valuable in industrial parks where usable land may cost $100,000-500,000 per acre. Ground-mount solar can avoid roof replacement risk, which matters when a membrane has less than 10-12 years of remaining life. A procurement manager should never approve rooftop PV on a roof that will require full replacement before year 15 unless removal and reinstallation costs are included.
Technical Performance and ROI by Application
Ground-mount solar can produce 5-15% more annual energy than rooftop solar, but rooftop projects may still deliver better ROI by avoiding land and civil costs.
The technical advantage of ground-mount comes from design freedom. Engineers can set tilt, azimuth, row spacing, inverter pad location, cable routing, and cleaning access around energy yield. Rooftop arrays must accept roof orientation, setbacks, parapet shading, fire corridors, mechanical equipment, drainage paths, and structural attachment limits.
Module selection narrows the performance gap. SOLARTODO's 243 kW institutional rooftop configuration uses 24.2% TOPCon modules, a 20 degree fixed tilt, about 1,250 m2 of roof envelope, and 383 MWh/year indicative generation. SOLARTODO's 50 kW greenhouse rooftop configuration uses bifacial TOPCon or HJT modules at about 22% efficiency and targets 72-85 MWh/year, depending on irradiance and rear-side gain.
According to IRENA (2025), global utility-scale solar PV LCOE was $0.043/kWh in 2024, while the United States utility-scale value was about $0.070/kWh. IRENA states, "Renewables remained the most cost-competitive option for new electricity generation in 2024." That statement supports solar procurement generally, but rooftop and ground-mount ROI still require local electricity tariffs and construction cost inputs.
| North America application | Recommended mount | Typical size | Payback at $0.10/kWh | Payback at $0.15/kWh | Payback at $0.24/kWh |
|---|---|---|---|---|---|
| Distribution warehouse | Rooftop | 250 kW-2 MW | 7.0-9.5 years | 4.8-6.7 years | 3.3-4.8 years |
| University or hospital campus | Rooftop plus carport | 500 kW-5 MW | 7.5-10.5 years | 5.0-7.2 years | 3.6-5.2 years |
| Manufacturing plant with vacant land | Ground-mount | 1-10 MW | 6.0-8.5 years | 4.0-6.0 years | 2.8-4.5 years |
| Agricultural processor | Ground-mount or greenhouse rooftop | 100 kW-3 MW | 5.8-8.0 years | 3.9-5.8 years | 2.7-4.3 years |
| Municipal water utility | Ground-mount | 500 kW-5 MW | 6.2-8.8 years | 4.2-6.2 years | 3.0-4.7 years |
These paybacks assume PV-only systems, 25-year module life, 10-year inverter warranty, 0.4-0.55% annual degradation, and no major roof replacement. They also assume self-consumption or export compensation close to retail value. Where net billing pays only wholesale value, batteries or load shifting may be needed to preserve ROI.
Year-Over-Year Trends and 2030 Outlook
From 2021 to 2026, solar costs fell mainly through module efficiency gains, while North American soft costs and interconnection queues became the main ROI constraint.
Historical data show a split trend. According to NREL (2021), commercial rooftop PV benchmark cost was $1.56/Wdc and commercial ground-mount was $1.64/Wdc in Q1 2021. According to DOE (2025), a 2024Q1 3 MW agrivoltaic benchmark reached $1.51/Wdc modeled market price, while residential rooftop remained much higher at $3.15/Wdc because customer acquisition, permitting, and labor dominate small systems.
According to Wood Mackenzie and SEIA (2026), U.S. commercial solar added 2,345 MWdc in 2025, up 6% from 2024, while utility-scale solar installed 34.7 GWdc. Their pricing summary reported commercial system pricing up 10% year over year and fixed-tilt utility pricing up 11%, which means buyers should not assume every 2026 quote is cheaper than 2024. According to IRENA (2025), global crystalline silicon module costs declined 97% from January 2010 to December 2024, but balance-of-system costs made up about 65% of utility-scale installed cost in 2024.
| Period | Market status | Cost and technology signal | Procurement implication |
|---|---|---|---|
| 2021-2022 | Supply-chain disruption and higher freight | Commercial rooftop around $1.56/Wdc in NREL Q1 2021 benchmark | Lock logistics and equipment alternates early |
| 2023-2024 | Module oversupply and TOPCon scale-up | IRENA solar PV LCOE reached $0.043/kWh in 2024 | Equipment savings shifted attention to BOS and labor |
| 2025-2026 | U.S. policy and tariff volatility | U.S. installed 43.2 GWdc in 2025; commercial pricing rose 10% YoY | Compare domestic, imported, FOB, CIF, and EPC packages |
| 2027-2030 | Commercial solar growth resumes after transition | SEIA/WoodMac projected 6% average annual commercial growth from 2027-2030 | Standardized BOMs and portfolio procurement improve pricing |
| 2030-2040 | Tandem, bifacial, AI O&M, and storage integration mature | IRENA expects solar PV installed costs near $388/kW over the next 5 years globally | Hybrid PV-plus-storage will increasingly define firm-value ROI |
For B2B buyers, the 2030 message is practical: module price is no longer the only lever. Engineering standardization, interconnection discipline, racking optimization, inverter availability, and local installation productivity can matter more than another $0.02/W module discount. SOLARTODO's role is to support engineered procurement, export supply, EPC coordination, and financing discussions rather than operating as an online marketplace.
EPC Investment Analysis and Pricing Structure
A North American EPC quotation should show FOB, CIF, and turnkey pricing because delivery scope can change a solar budget by 20-45%.
EPC means Engineering, Procurement, and Construction. A turnkey EPC scope normally includes layout engineering, structural or geotechnical review, electrical single-line design, equipment procurement, mounting installation, DC wiring, AC integration, monitoring setup, grid-interface documentation, commissioning, as-built drawings, and warranty handover. Rooftop EPC adds roof attachment and waterproofing coordination; ground-mount EPC adds land preparation, pile driving, trenching, fencing, and civil drainage.
SOLARTODO can structure B2B quotations across three commercial tiers. FOB Supply covers equipment at origin and suits buyers with their own freight and installers. CIF Delivered adds ocean freight and insurance to the destination port. EPC Turnkey adds engineering, installation, commissioning, and local acceptance coordination where project partners are available.
| Pricing tier | Rooftop scope basis | Ground-mount scope basis | Procurement note |
|---|---|---|---|
| FOB Supply | Modules, inverters, cable, rails, protection, monitoring | Modules, inverters, racking, cable, protection, monitoring | Lowest quoted price, excludes freight, duties, installation |
| CIF Delivered | FOB equipment plus ocean freight and insurance | FOB equipment plus freight for longer racking profiles | Useful for importer-controlled installation teams |
| EPC Turnkey | Delivered, installed, commissioned rooftop PV | Delivered, installed, commissioned ground array | Best for buyers requiring single-point delivery accountability |
Volume guidance should be stated before final BOM freeze. SOLARTODO typically models 50+ standardized systems at a 5% discount, 100+ systems at 10%, and 250+ systems at 15%, subject to module brand, inverter brand, shipment schedule, and framework contract terms. For a 1 MW C&I project, a 10% equipment discount can reduce procurement cost by $70,000-120,000 depending on scope.
Payment terms are 30% T/T deposit plus 70% against bill of lading, or 100% irrevocable L/C at sight for qualified buyers. Project financing can be discussed for large projects above $1,000K. Procurement teams should contact [email protected] with roof drawings, site plan, 12-month interval load data, grid voltage, target Incoterms, and commissioning month.
Conclusion
For North America in 2026, rooftop solar is usually the faster real-estate-efficient option, while ground-mount solar often wins the lowest-LCOE case above 500 kW.
The bottom line: rooftop solar at $1.65-2.40/Wdc is best for constrained commercial facilities, while ground-mount solar at $1.45-2.15/Wdc can deliver 5-15% more yield where land, interconnection, and permitting are favorable. SOLARTODO recommends requesting both layouts for any site above 500 kW because a 10% yield difference or $0.03/kWh tariff difference can change the ROI ranking.
FAQ
Rooftop and ground-mount solar questions in 2026 should be answered with cost per watt, annual kWh yield, tariff offset, and project risk.
Q: What is the main cost difference between rooftop and ground-mount solar in 2026? A: Rooftop commercial solar typically costs $1.65-2.40/Wdc in North America, while ground-mount systems usually cost $1.45-2.15/Wdc for C&I scale. Rooftop avoids land and foundations, but ground-mount often has faster installation access and better yield. Final pricing depends on roof condition, soil class, utility upgrades, and labor market.
Q: Which option has better ROI for a warehouse? A: Rooftop solar usually has better ROI for warehouses when the roof is structurally ready and electricity is consumed during daylight hours. A 250 kW-2 MW rooftop array can pay back in about 4.8-6.7 years at $0.15/kWh. If the roof needs replacement within 10-12 years, ground-mount or carport solar may be safer.
Q: When does ground-mount solar outperform rooftop solar? A: Ground-mount solar outperforms rooftop solar when land is available, interconnection is practical, and the layout can improve annual yield by 5-15%. It is especially strong for factories, farms, water utilities, and campuses above 500 kW. Tracking systems can improve output further, but they add mechanical cost and O&M.
Q: How should procurement teams calculate payback? A: Calculate payback by dividing net installed cost by annual savings after O&M. Annual savings equal solar kWh used on site multiplied by the avoided tariff, plus export revenue where applicable. Use 12-month interval data, not only annual bills, because demand charges and export limits can change results by 10-30%.
Q: What standards should be required in North American tenders? A: PV modules should reference IEC 61215 for design qualification and IEC 61730 or UL 61730 for safety. Grid-connected inverters should meet IEEE 1547 requirements in the United States and local utility interconnection rules in Canada or Mexico. Buyers should also require commissioning tests, labeling, monitoring access, and warranty certificates.
Q: Does rooftop solar require roof reinforcement? A: Sometimes, but not always. Engineers must check dead load, wind uplift, attachment spacing, waterproofing condition, parapet height, and fire access pathways. A typical commercial rooftop PV layout may need 8-15 kg/m2 added load depending on racking, ballast, and wind zone, so stamped structural review is essential before procurement.
Q: Is ground-mount solar easier to maintain? A: Ground-mount solar is usually easier to maintain because technicians can access modules, inverters, combiner boxes, and cable routes without roof safety constraints. O&M budgets often run $10-25/kW-year for ground-mount versus $15-35/kW-year for rooftop. Vegetation control, fencing, drainage, and security should be included in the ground-mount plan.
Q: How do incentives affect rooftop versus ground-mount economics? A: Incentives can change the ranking if one layout qualifies faster or has lower domestic-content, labor, or interconnection risk. In the United States, federal tax-credit eligibility, prevailing wage, energy-community rules, and transferability can materially affect net cost. Buyers should model both pre-incentive and post-incentive payback before selecting the mounting type.
Q: What should be included in an EPC quote? A: An EPC quote should include engineering, equipment, installation, grid-interface documentation, monitoring, commissioning, as-built drawings, and warranty handover. Rooftop quotes should include structural and waterproofing assumptions; ground-mount quotes should include civil works and geotechnical assumptions. SOLARTODO can quote FOB Supply, CIF Delivered, or EPC Turnkey scope.
Q: How long do rooftop and ground-mount systems last? A: Both system types commonly use PV modules with 25-year product coverage and 30-year performance expectations, while string inverters often carry 10-year warranties. Mounting structures are typically designed for 25+ years. Rooftop system life is also constrained by roof membrane life, so reroofing timing should be part of the financial model.
References
- IRENA (2025): Renewable Power Generation Costs in 2024; reports global utility-scale solar PV LCOE of $0.043/kWh and installed cost of $691/kW. — https://www.irena.org/Data/View-data-by-topic/Capacity-and-Generation
- IEA (2025): Renewables 2025; projects 4,600 GW of renewable additions from 2025-2030, with solar PV nearly 80% of growth. — https://www.iea.org/reports/world-energy-outlook-2024
- NREL (2023): U.S. Solar Photovoltaic System and Energy Storage Cost Benchmarks Q1 2023; provides MSP and MMP methodology for U.S. PV cost modeling. — https://www.nrel.gov/research/data-tools.html
- Wood Mackenzie and SEIA (2026): U.S. Solar Market Insight 2025 Year in Review; reports 43.2 GWdc U.S. solar installations in 2025. — https://www.woodmac.com/
- IEC 61215 and IEC 61730 (2021-2023): PV module design qualification and safety requirements used in bankable technical specifications. — https://webstore.iec.ch/
- IEEE 1547 (2018): Interconnection and interoperability standard for distributed energy resources connected to electric power systems. — https://standards.ieee.org/ieee/1547/7382/ The strongest 2026 solar cost analysis uses DOE, NREL, IRENA, IEA, EIA, SEIA, Wood Mackenzie, IEC, UL, and IEEE sources.
- IRENA (2025): Renewable Power Generation Costs in 2024; reports global utility-scale solar PV LCOE of $0.043/kWh and installed cost of $691/kW.
- IEA (2025): Renewables 2025; projects 4,600 GW of renewable additions from 2025-2030, with solar PV nearly 80% of growth.
- U.S. Department of Energy (2025): 2024Q1 Solar Photovoltaic System Cost Benchmarks; reports PV benchmark prices and LCOE by system type.
- NREL (2023): U.S. Solar Photovoltaic System and Energy Storage Cost Benchmarks Q1 2023; provides MSP and MMP methodology for U.S. PV cost modeling.
- EIA (2026): Electric Power Monthly price data; reports 2025 U.S. commercial electricity average of 13.41 cents/kWh.
- Wood Mackenzie and SEIA (2026): U.S. Solar Market Insight 2025 Year in Review; reports 43.2 GWdc U.S. solar installations in 2025.
- IEC 61215 and IEC 61730 (2021-2023): PV module design qualification and safety requirements used in bankable technical specifications.
- IEEE 1547 (2018): Interconnection and interoperability standard for distributed energy resources connected to electric power systems.
About SOLARTODO
SOLARTODO is a global integrated solution provider specializing in solar power generation systems, energy-storage products, smart street-lighting and solar street-lighting, intelligent security & IoT linkage systems, power transmission towers, telecom communication towers, and smart-agriculture solutions for worldwide B2B customers.
Procurement paths
About the Author

Cinn Song
Founder & Chief Solutions Architect
Cinn Song founded SOLARTODO LIMITED and leads its smart-city infrastructure engineering — from solar, storage and integrated smart poles to the company's push into physical-AI city edge nodes: pole-mounted edge computing, vertical LLMs for smart cities, drone-based O&M with autonomous battery swapping, robotic maintenance, and high-speed counter-UAS interception. Since 2010, he has directed turnkey EPC + BOT delivery across 50+ countries, including telecom monopole supply for national grid operators, off-grid solar street-lighting for African municipalities, and integrated smart-pole programs for Gulf smart cities.
Cite This Article
Cinn Song. (2026). Rooftop vs Ground-Mount Solar Cost Analysis 2026: ROI…. SOLARTODO. Retrieved from https://solartodo.com/knowledge/rooftop-vs-ground-mount-solar-cost-analysis-2026-roi-comparison-by-north-america-2
@article{solartodo_rooftop_vs_ground_mount_solar_cost_analysis_2026_roi_comparison_by_north_america_2,
  title = {Rooftop vs Ground-Mount Solar Cost Analysis 2026: ROI…},
  author = {Cinn Song},
  journal = {SOLARTODO Knowledge Base},
  year = {2026},
  url = {https://solartodo.com/knowledge/rooftop-vs-ground-mount-solar-cost-analysis-2026-roi-comparison-by-north-america-2},
  note = {Accessed: 2026-10-16}
}
Published: September 1, 2026 | Available at: https://solartodo.com/knowledge/rooftop-vs-ground-mount-solar-cost-analysis-2026-roi-comparison-by-north-america-2
Subscribe to Our Newsletter
Get the latest solar energy news and insights delivered to your inbox.
View All Articles